Analyze mode
Feature to help businesses track and analyze the performance of their communication workflows created using IMIconnect.
Analyze mode
Feature to help businesses track and analyze the performance of their communication workflows created using IMIconnect.
Analyze mode
Feature to help businesses track and analyze the performance of their communication workflows created using IMIconnect.
Analyze mode
Feature to help businesses track and analyze the performance of their communication workflows created using IMIconnect.

Results / Impact
Results / Impact
NPS 64
80 workflow developers participated in the research
35%
Reduced customer support tickets
1500
Charts were created in 7 days of launch
NPS 64
80 workflow developers participated in the research
35%
Reduced customer support tickets
1500
Charts were created in 7 days of launch
Results / Impact
NPS 64
80 workflow developers participated in the research
35%
Reduced customer support tickets
1500
Charts were created in 7 days of launch
Context
Context
What is IMIconnect?
It's a cloud communications platform that enables businesses to build, manage, and analyze multi-channel customer engagement strategies. IMIconnect provides tools for integrating various communication channels such as SMS, voice, email, push notifications, and more, allowing businesses to engage with their customers across multiple touchpoints. It's often used for customer support, marketing campaigns, and other communication needs.
Context
What is IMIconnect?
It's a cloud communications platform that enables businesses to build, manage, and analyze multi-channel customer engagement strategies. IMIconnect provides tools for integrating various communication channels such as SMS, voice, email, push notifications, and more, allowing businesses to engage with their customers across multiple touchpoints. It's often used for customer support, marketing campaigns, and other communication needs.
Discovery
Discovery
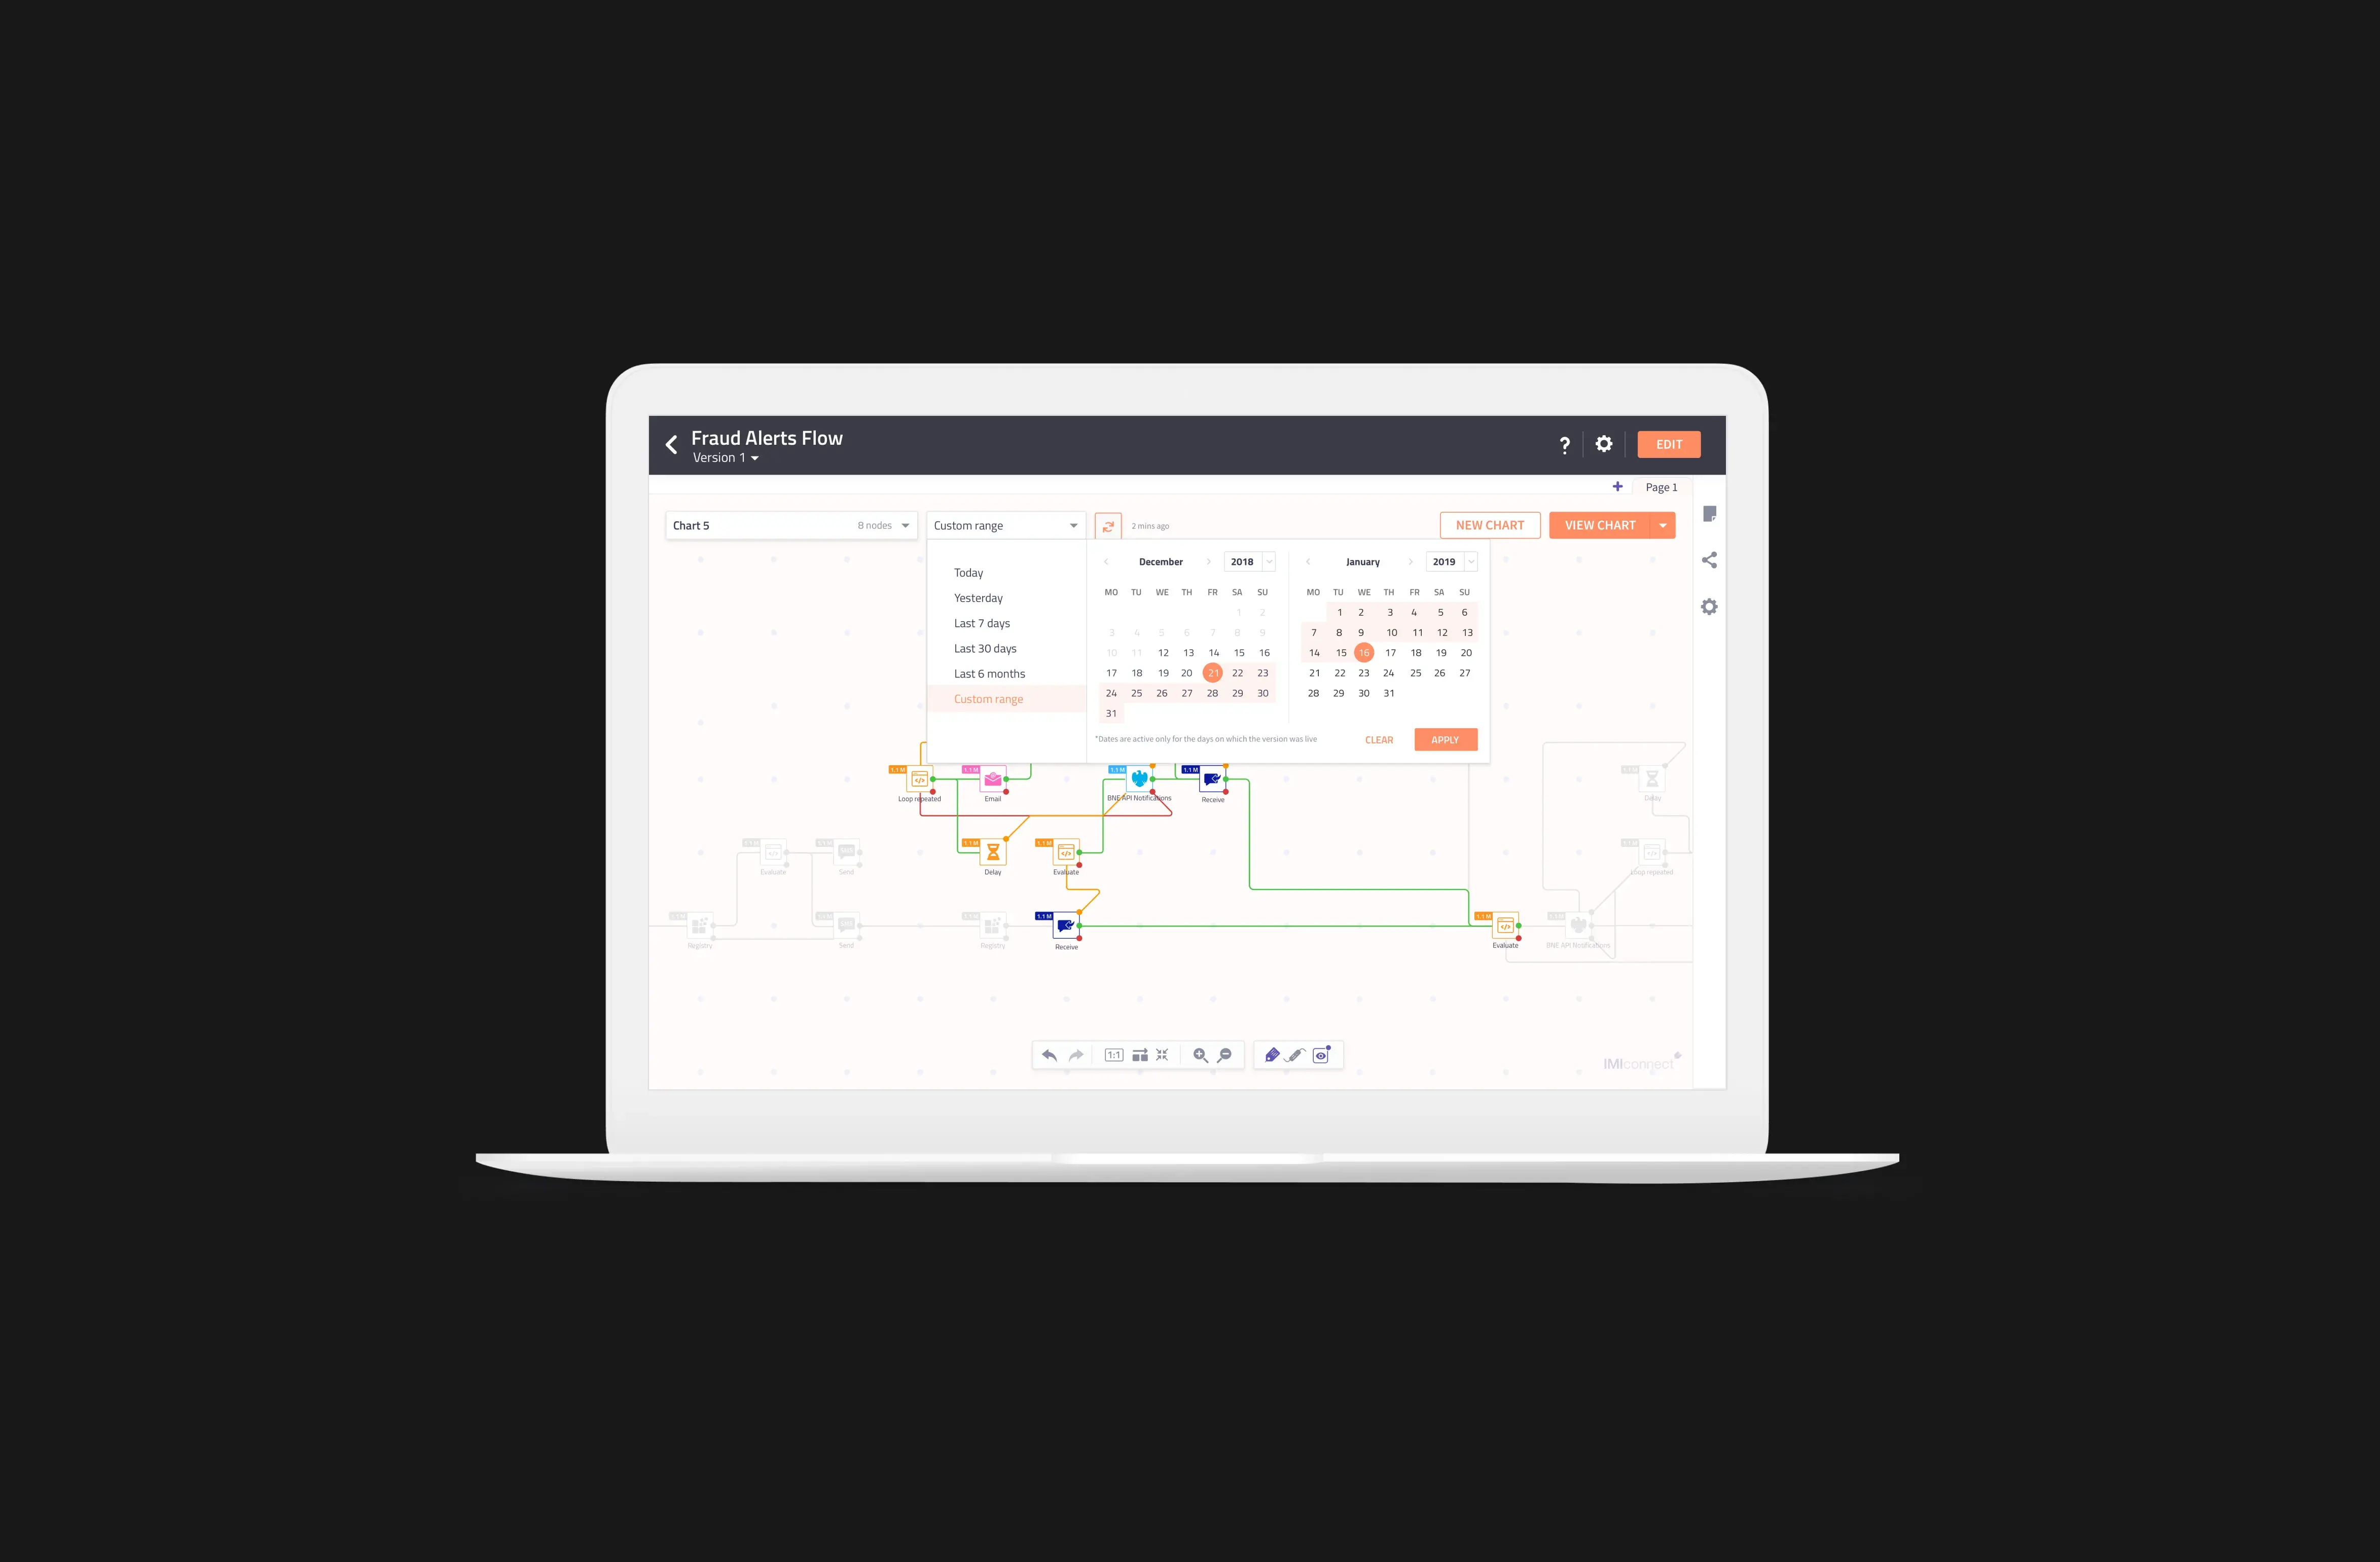
Analyze mode helps in tracking the transaction traffic within each workflows on a version level. It gives the user an aggregate view of the communication flow at every node which helps the user to explore and analyse the flow at different touch points.
Analyze mode helps in tracking the transaction traffic within each workflows on a version level. It gives the user an aggregate view of the communication flow at every node which helps the user to explore and analyse the flow at different touch points.
Discovery
Analyze mode helps in tracking the transaction traffic within each workflows on a version level. It gives the user an aggregate view of the communication flow at every node which helps the user to explore and analyse the flow at different touch points.
Discovery
Discovery
Key problems identified:
Inability to view the flow performance in real-time/near real-time.
Non-visibility into no. of customers who have responded to an outbound message.
Higher time taken to get the aggregate counts at various customer touch-points.
Difficulty in identifying the errors at every node in the flow.
Inability to diagnose the flow easily and make necessary changes in the flow as per the trend and customer response pattern.
Discovery
We had three primary goals:
Improve the experience of game serving interface.
Unify the scoring criteria to reduce complexities while keep it scalable for other games.
Provide a seamless experience across current gameplays that we have and the new ones.
Design
Design
Lets take a look at the solutions we developed
Problem statement 1
Once the flow is built and made live, I am not able to know at which node how many transactions are running successfully and at which node there are drop-outs caused by errors or failure. I don’t have a view on how the flow is performing, how well are we reaching our customers and how is our customer responding to us in my communication flow.
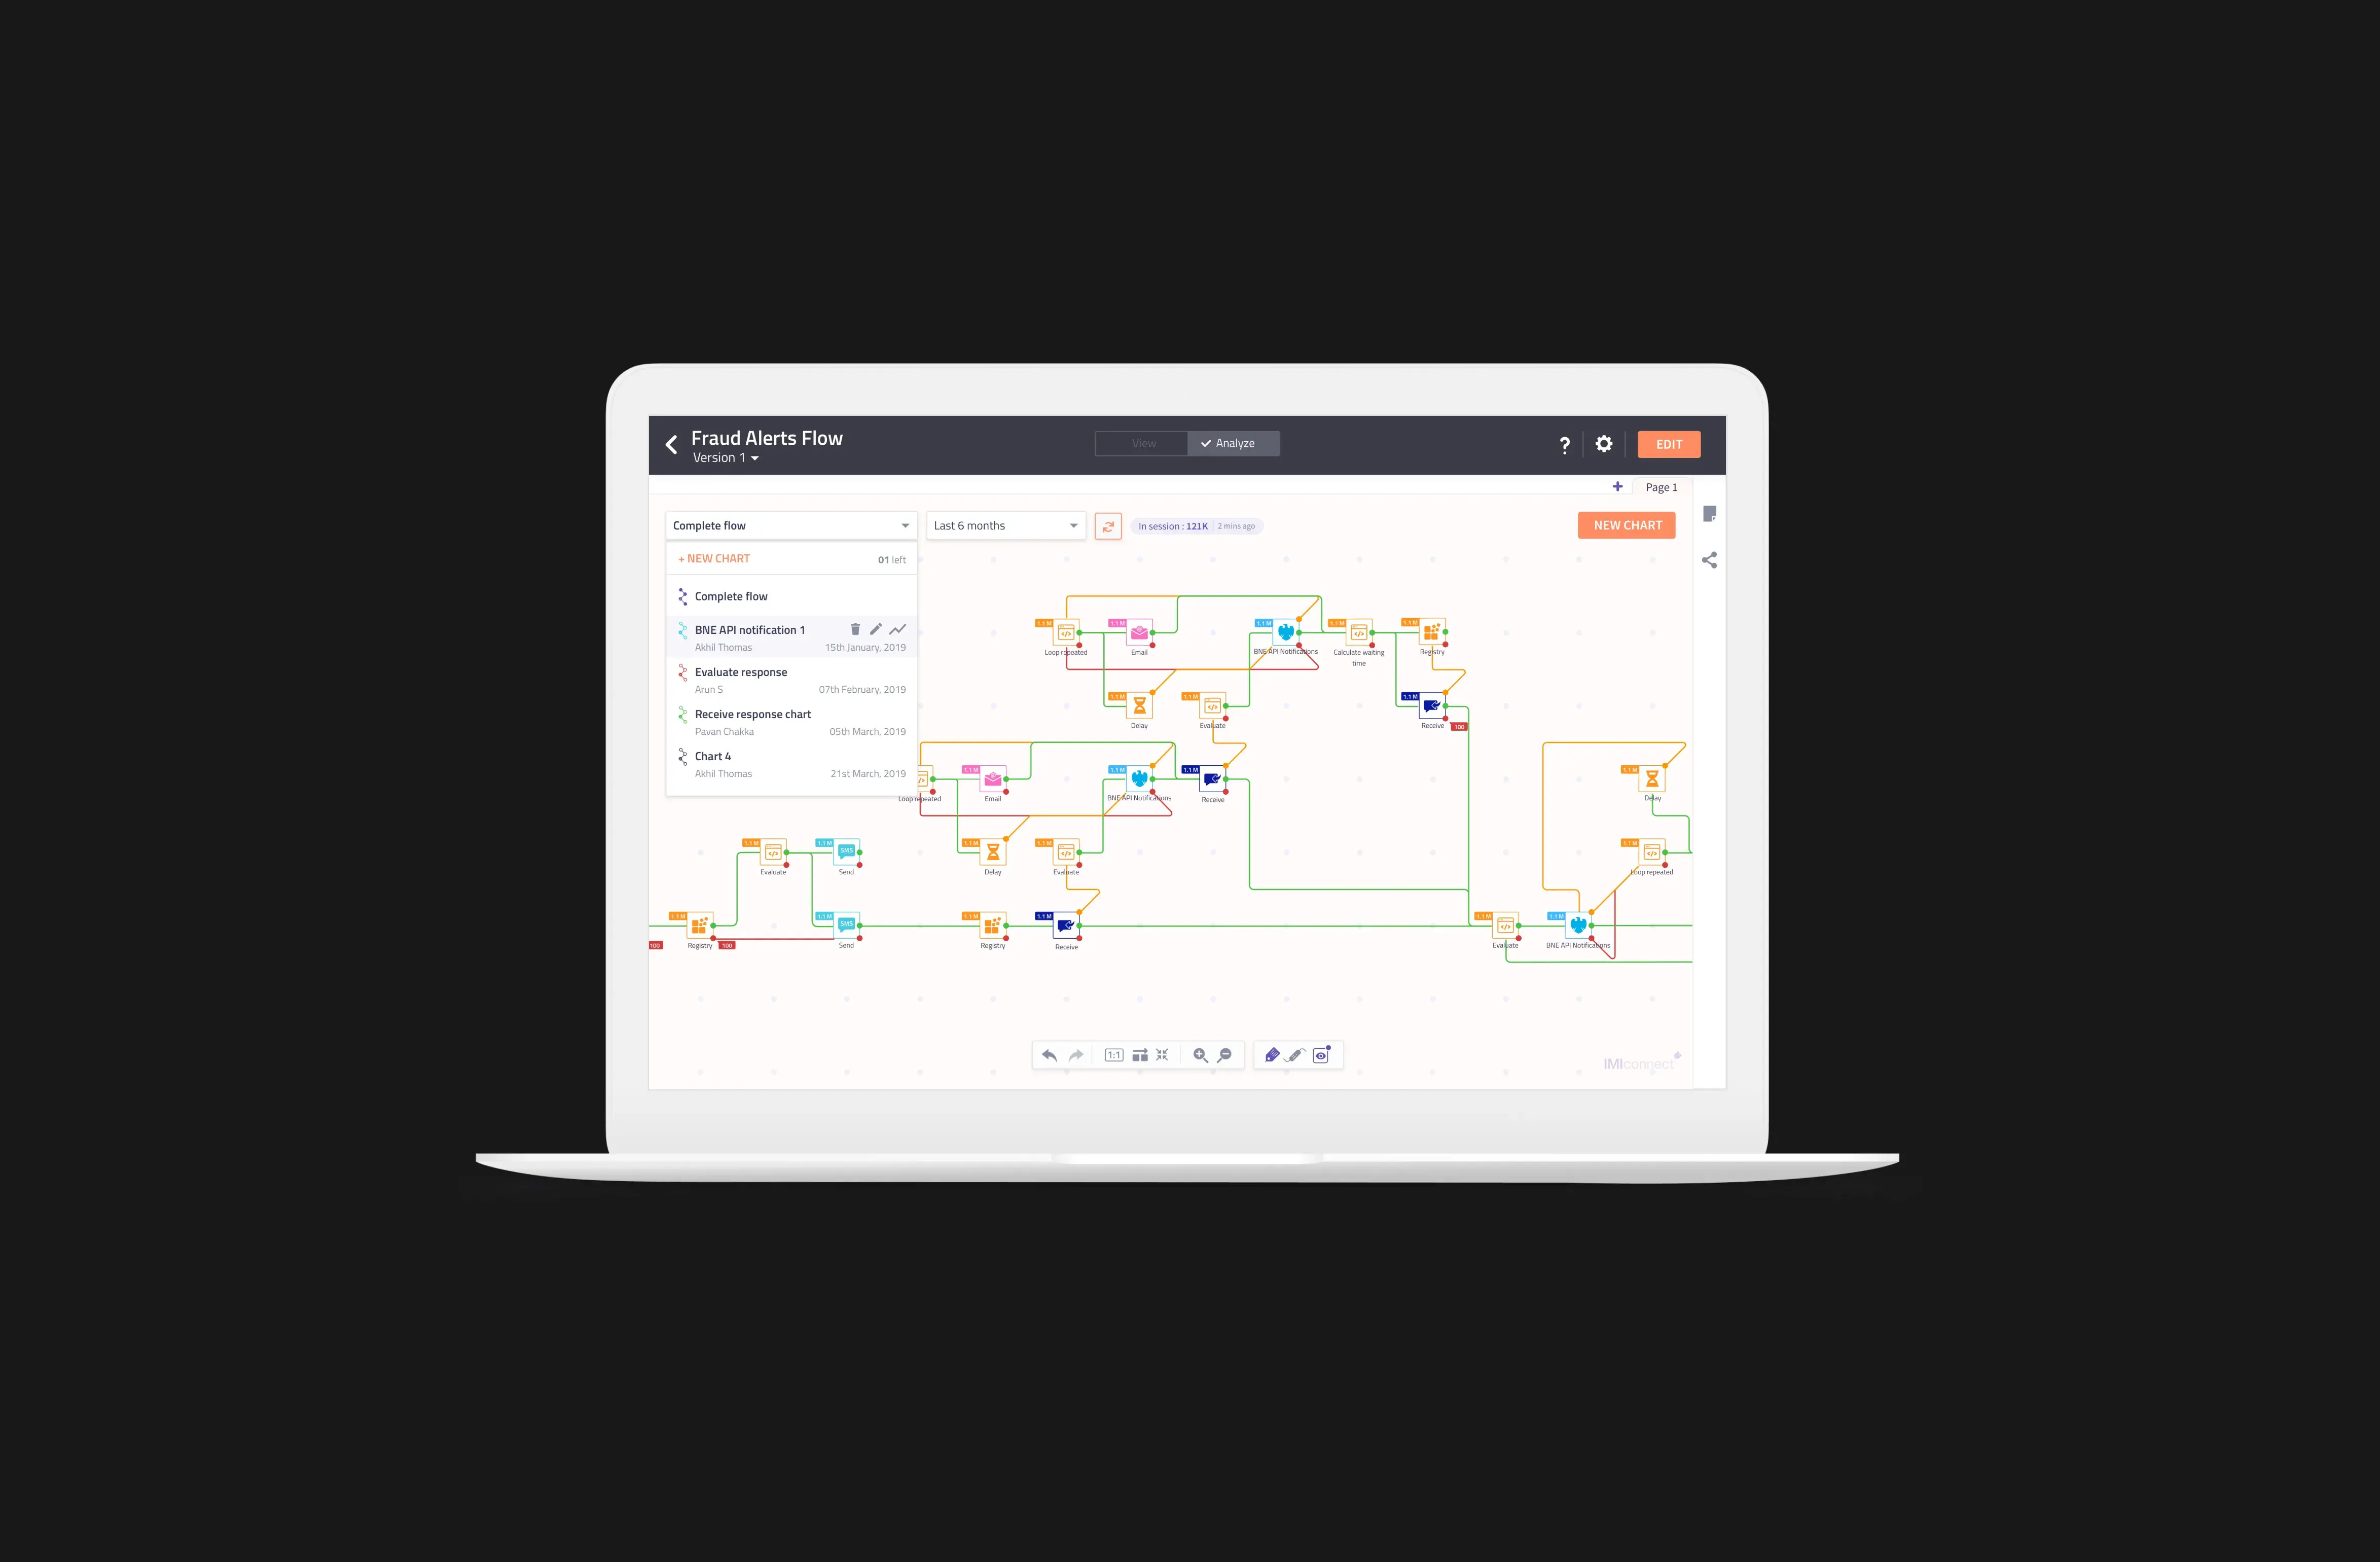
Solution
When a flow is built and made live, providing a view to the user with the transaction information as counters at each node for every node outcome on the connector linked to the node will be an upfront insight view. This view as an analytics mode on the flow canvas will solve the problem for the user of not being able to know the flow performance and if required can modify the flow as per the customer pattern identified in the analysis.
Lets take a look at the solutions we developed
Problem statement 1
Once the flow is built and made live, I am not able to know at which node how many transactions are running successfully and at which node there are drop-outs caused by errors or failure. I don’t have a view on how the flow is performing, how well are we reaching our customers and how is our customer responding to us in my communication flow.
Solution
When a flow is built and made live, providing a view to the user with the transaction information as counters at each node for every node outcome on the connector linked to the node will be an upfront insight view. This view as an analytics mode on the flow canvas will solve the problem for the user of not being able to know the flow performance and if required can modify the flow as per the customer pattern identified in the analysis.
Design
Lets take a look at the solutions we developed
Problem statement 1
Once the flow is built and made live, I am not able to know at which node how many transactions are running successfully and at which node there are drop-outs caused by errors or failure. I don’t have a view on how the flow is performing, how well are we reaching our customers and how is our customer responding to us in my communication flow.
Solution
When a flow is built and made live, providing a view to the user with the transaction information as counters at each node for every node outcome on the connector linked to the node will be an upfront insight view. This view as an analytics mode on the flow canvas will solve the problem for the user of not being able to know the flow performance and if required can modify the flow as per the customer pattern identified in the analysis.

Design
Design
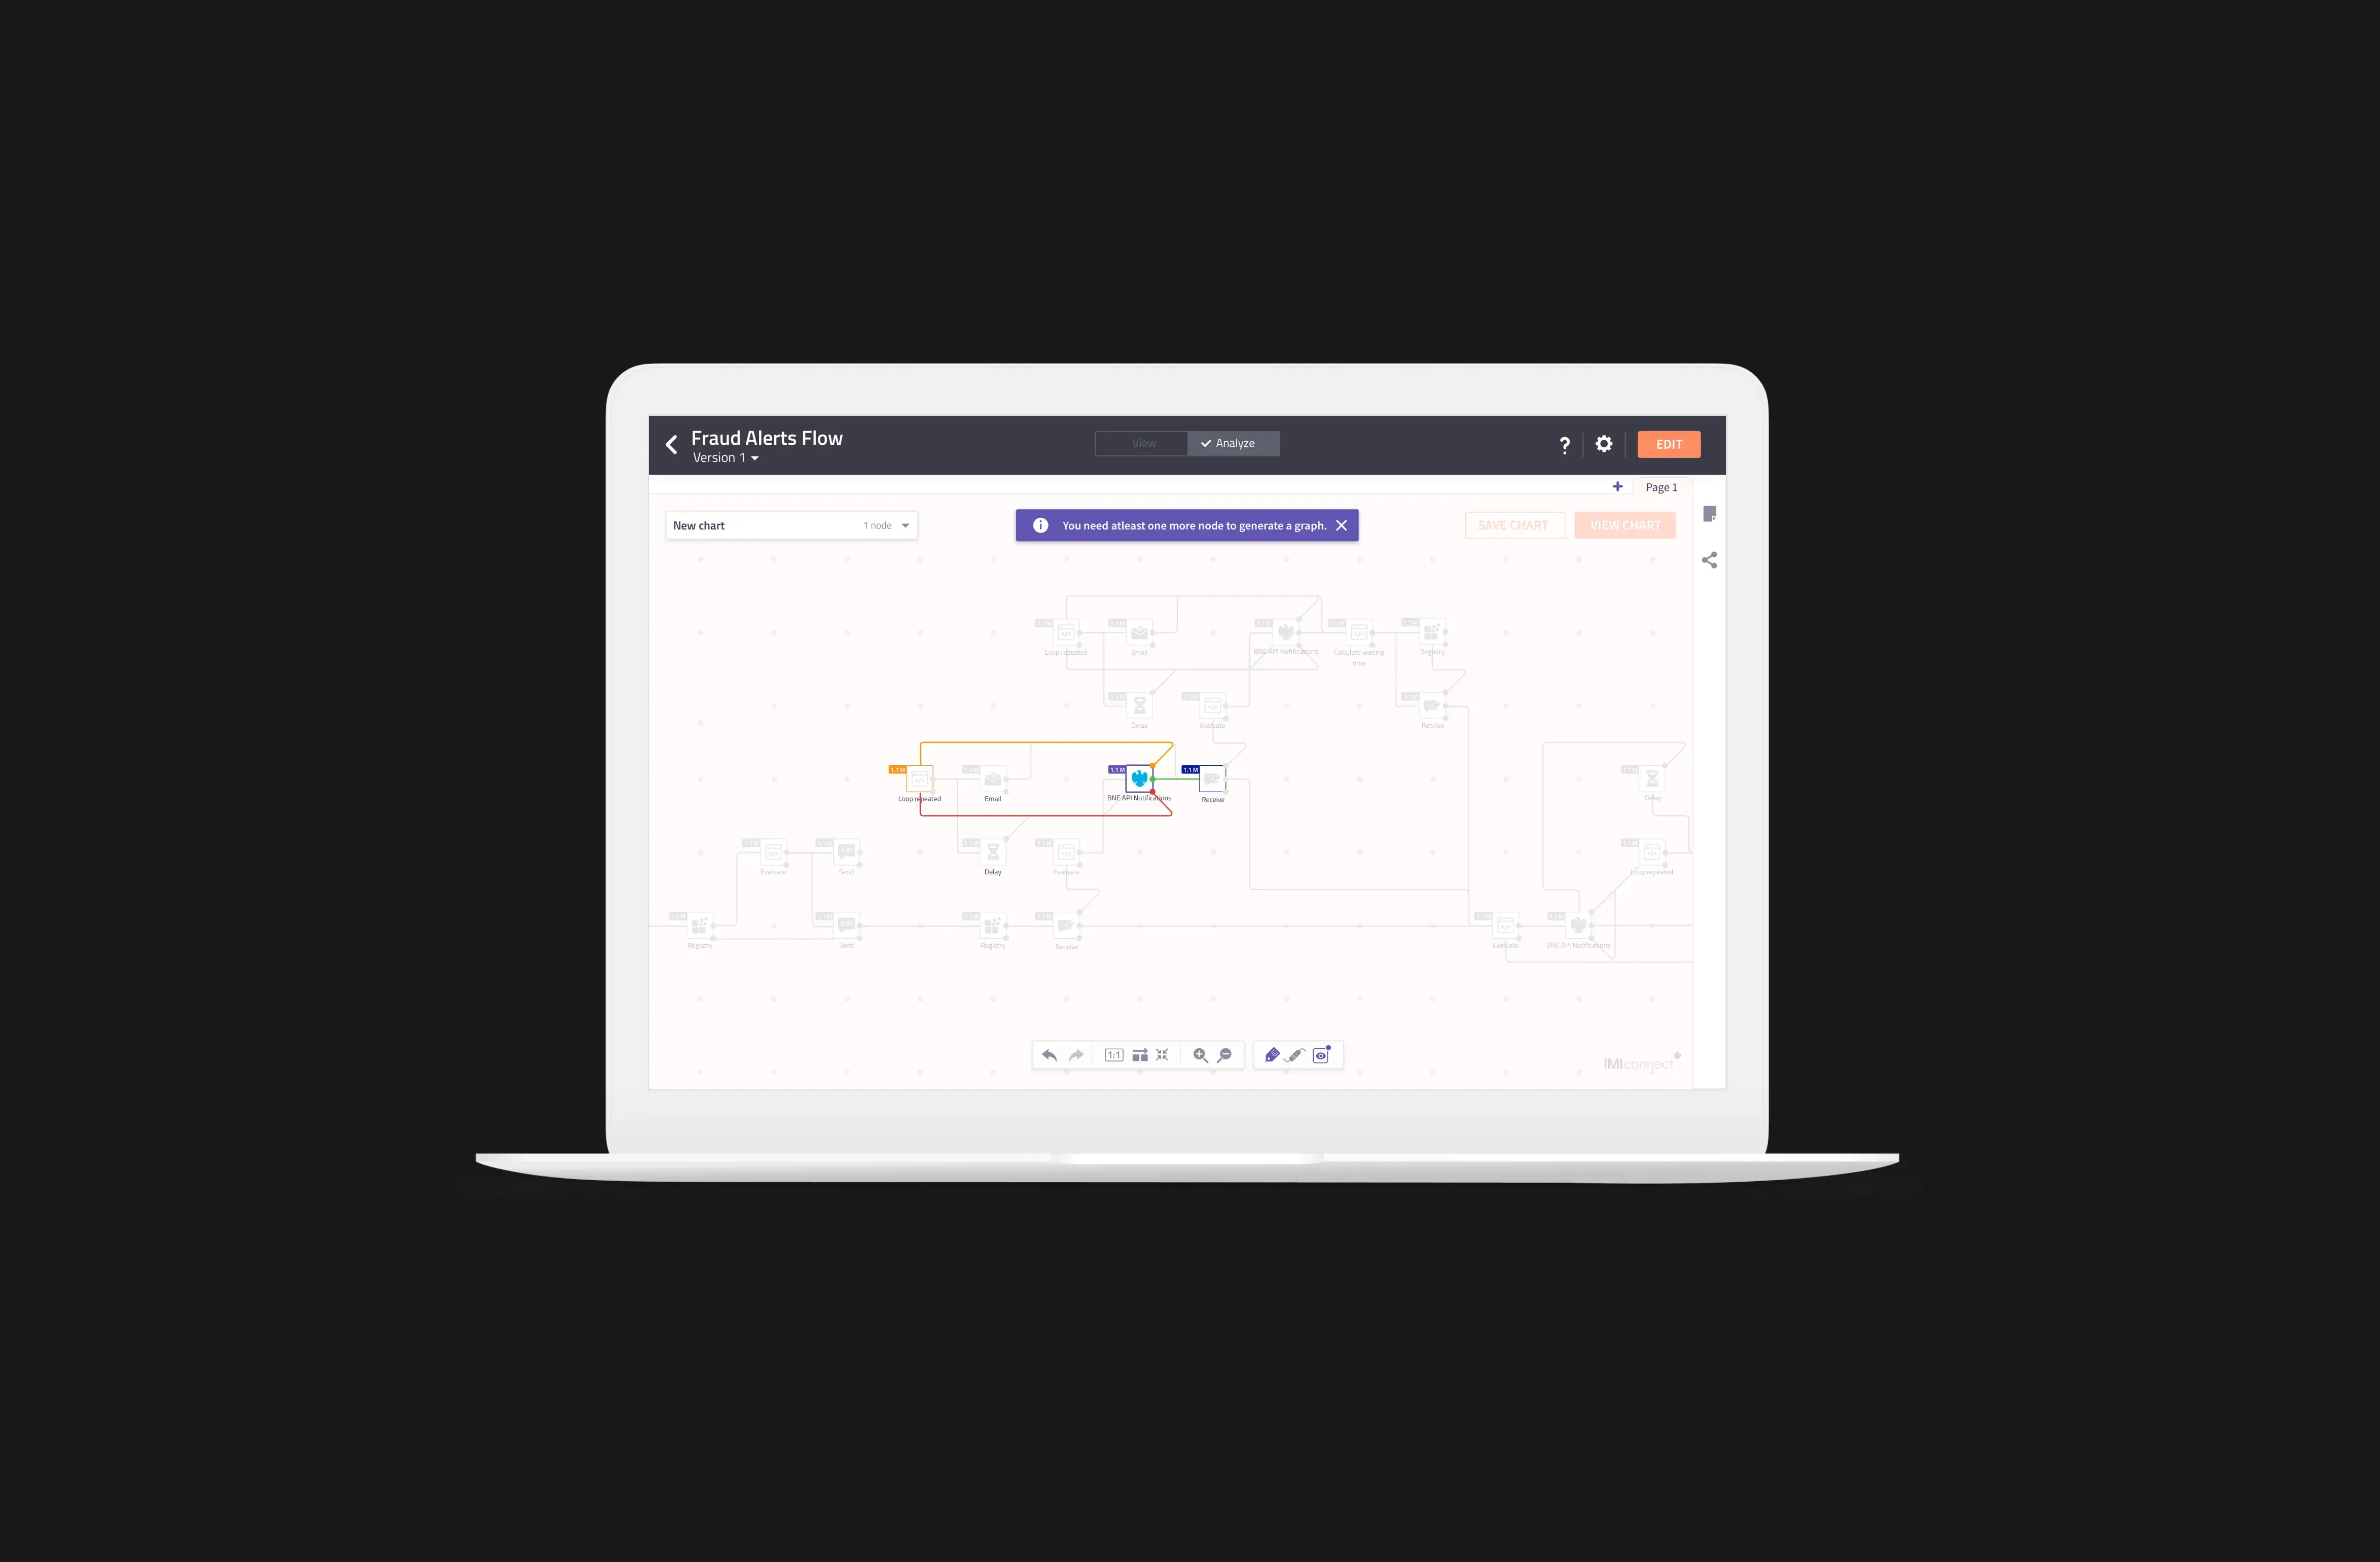
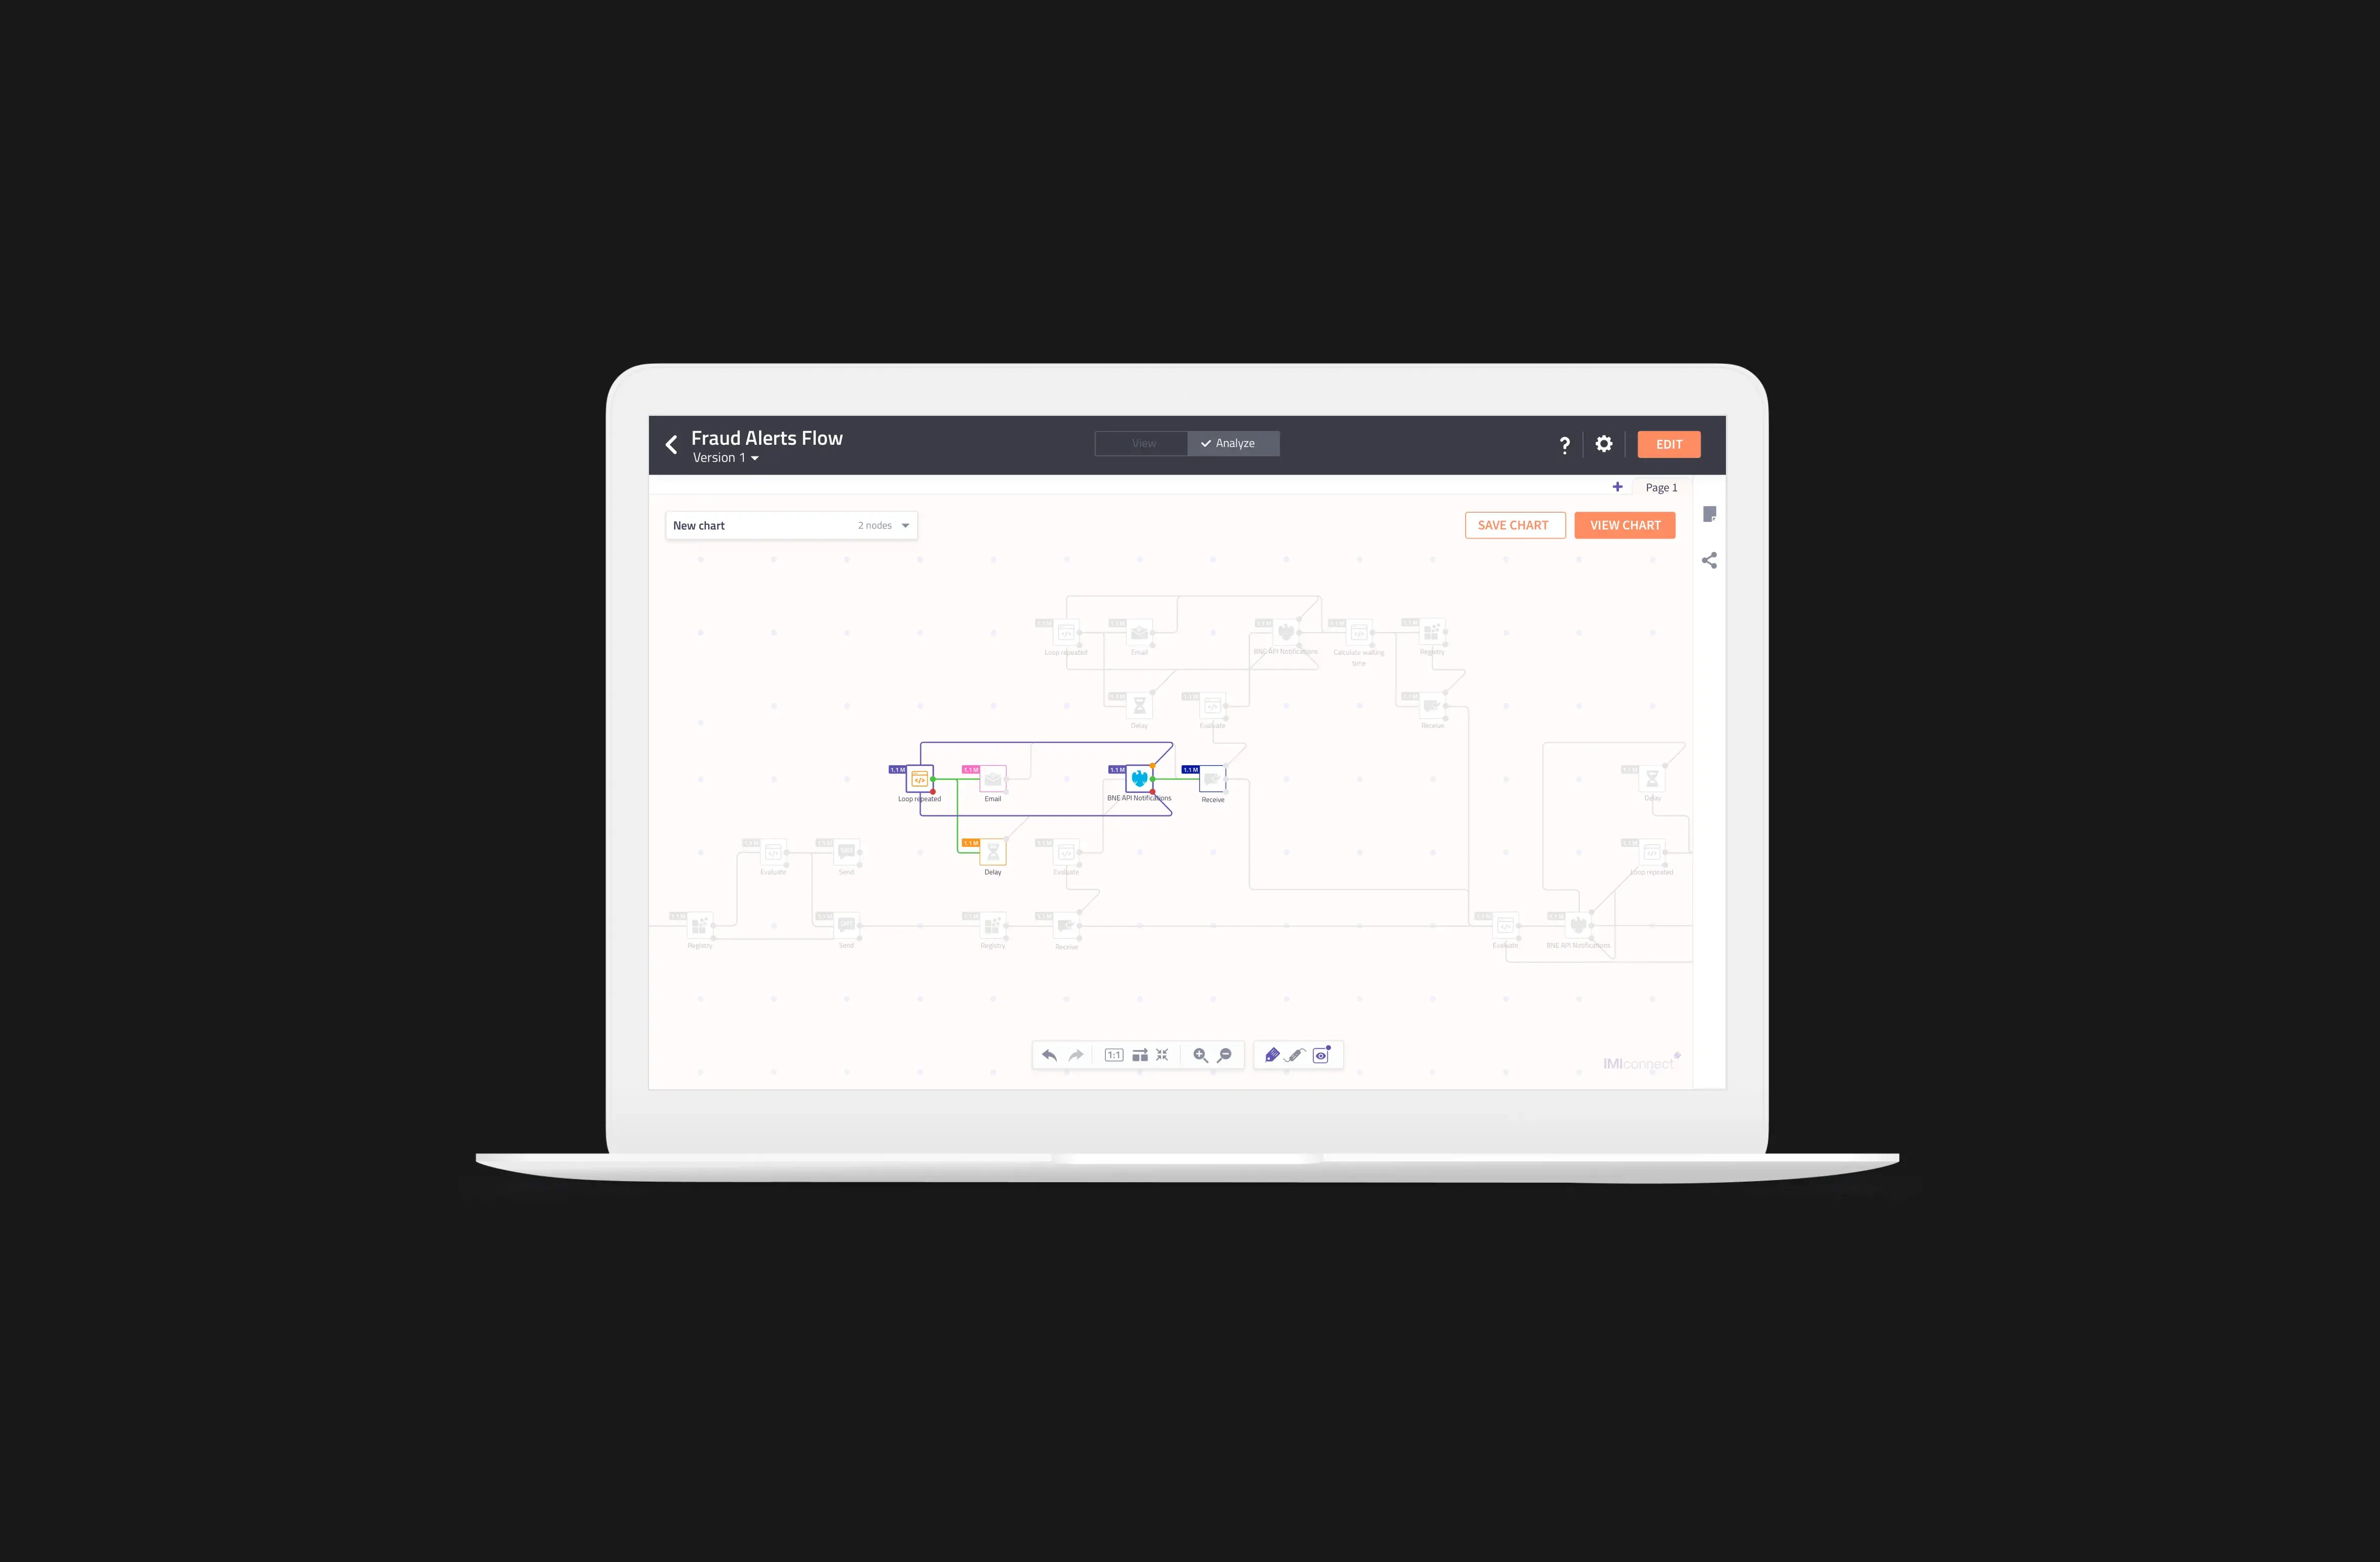
Problem statement 2
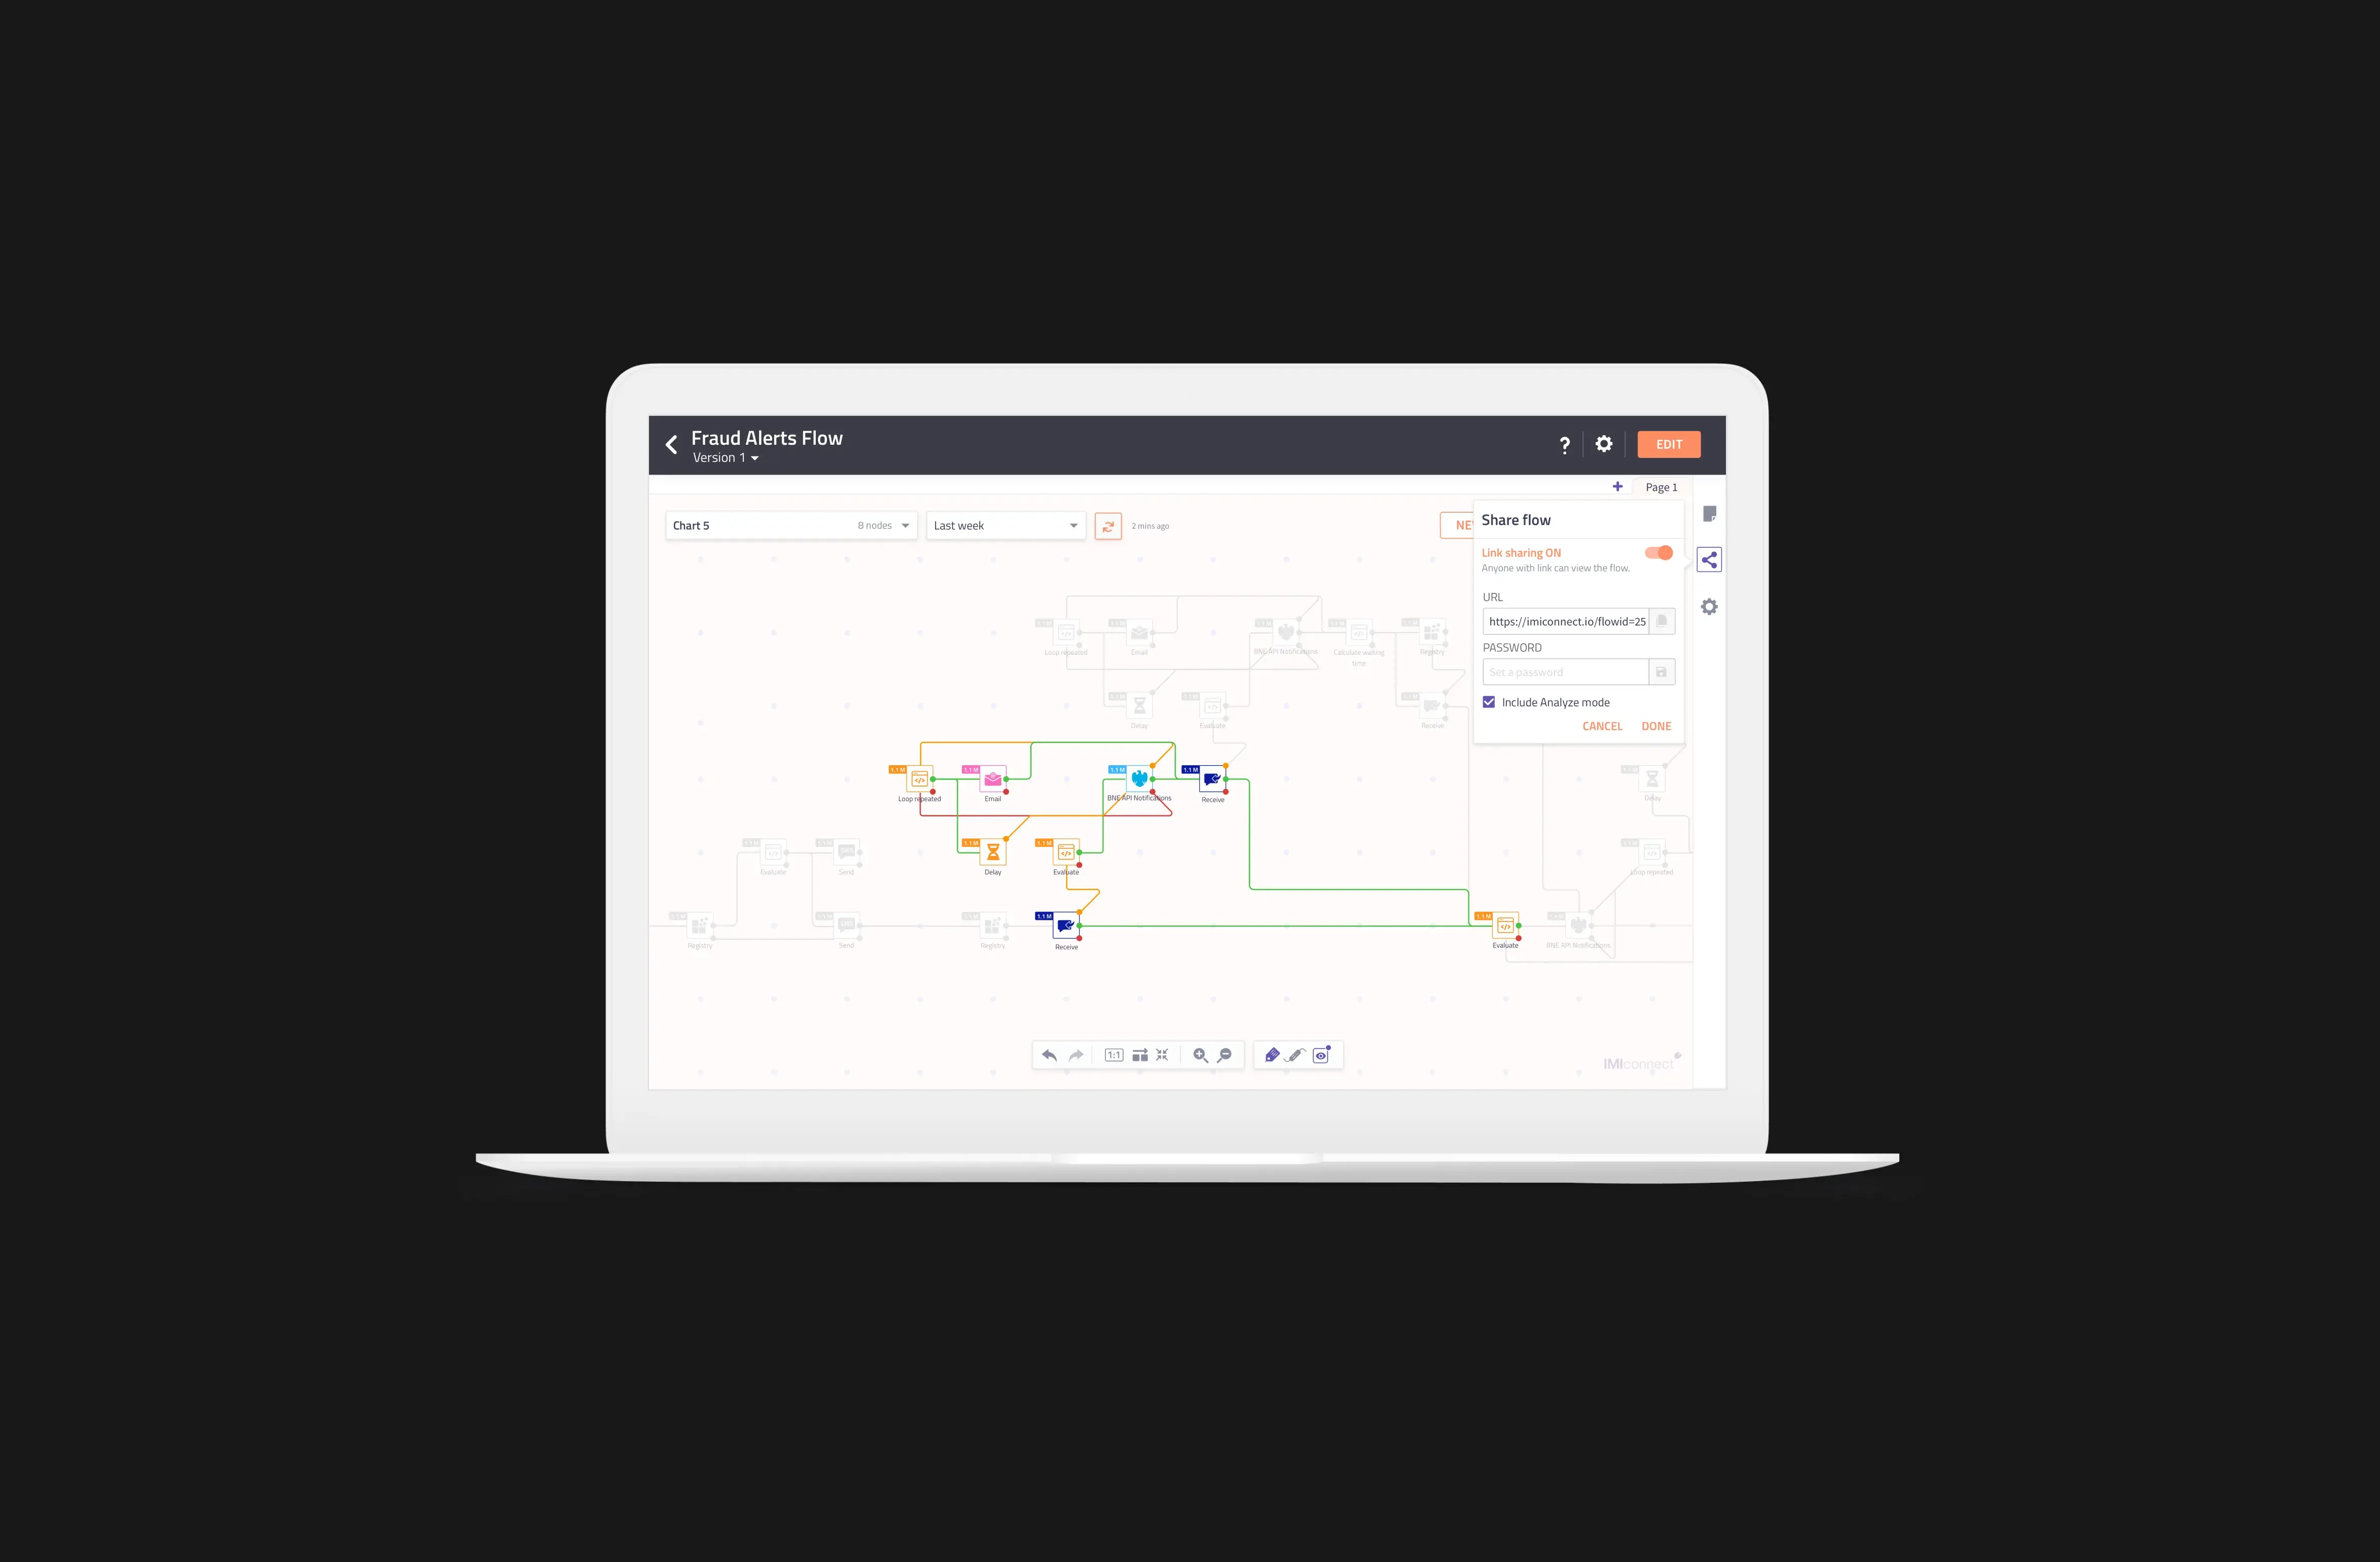
Once the flow is live, I don’t have the ability to analyse different segments in the flow which I consider as business outcomes.
Solution
Enable users to select parts of the flow which are relevant and to analyse them separately. Hence, we provided the option to create multiple segments and save them so that users can refer them in future as well.
Problem statement 2
Once the flow is live, I don’t have the ability to analyse different segments in the flow which I consider as business outcomes.
Solution
Enable users to select parts of the flow which are relevant and to analyse them separately. Hence, we provided the option to create multiple segments and save them so that users can refer them in future as well.
Design
Problem statement 2
Once the flow is live, I don’t have the ability to analyse different segments in the flow which I consider as business outcomes.
Solution
Enable users to select parts of the flow which are relevant and to analyse them separately. Hence, we provided the option to create multiple segments and save them so that users can refer them in future as well.


Design
Design
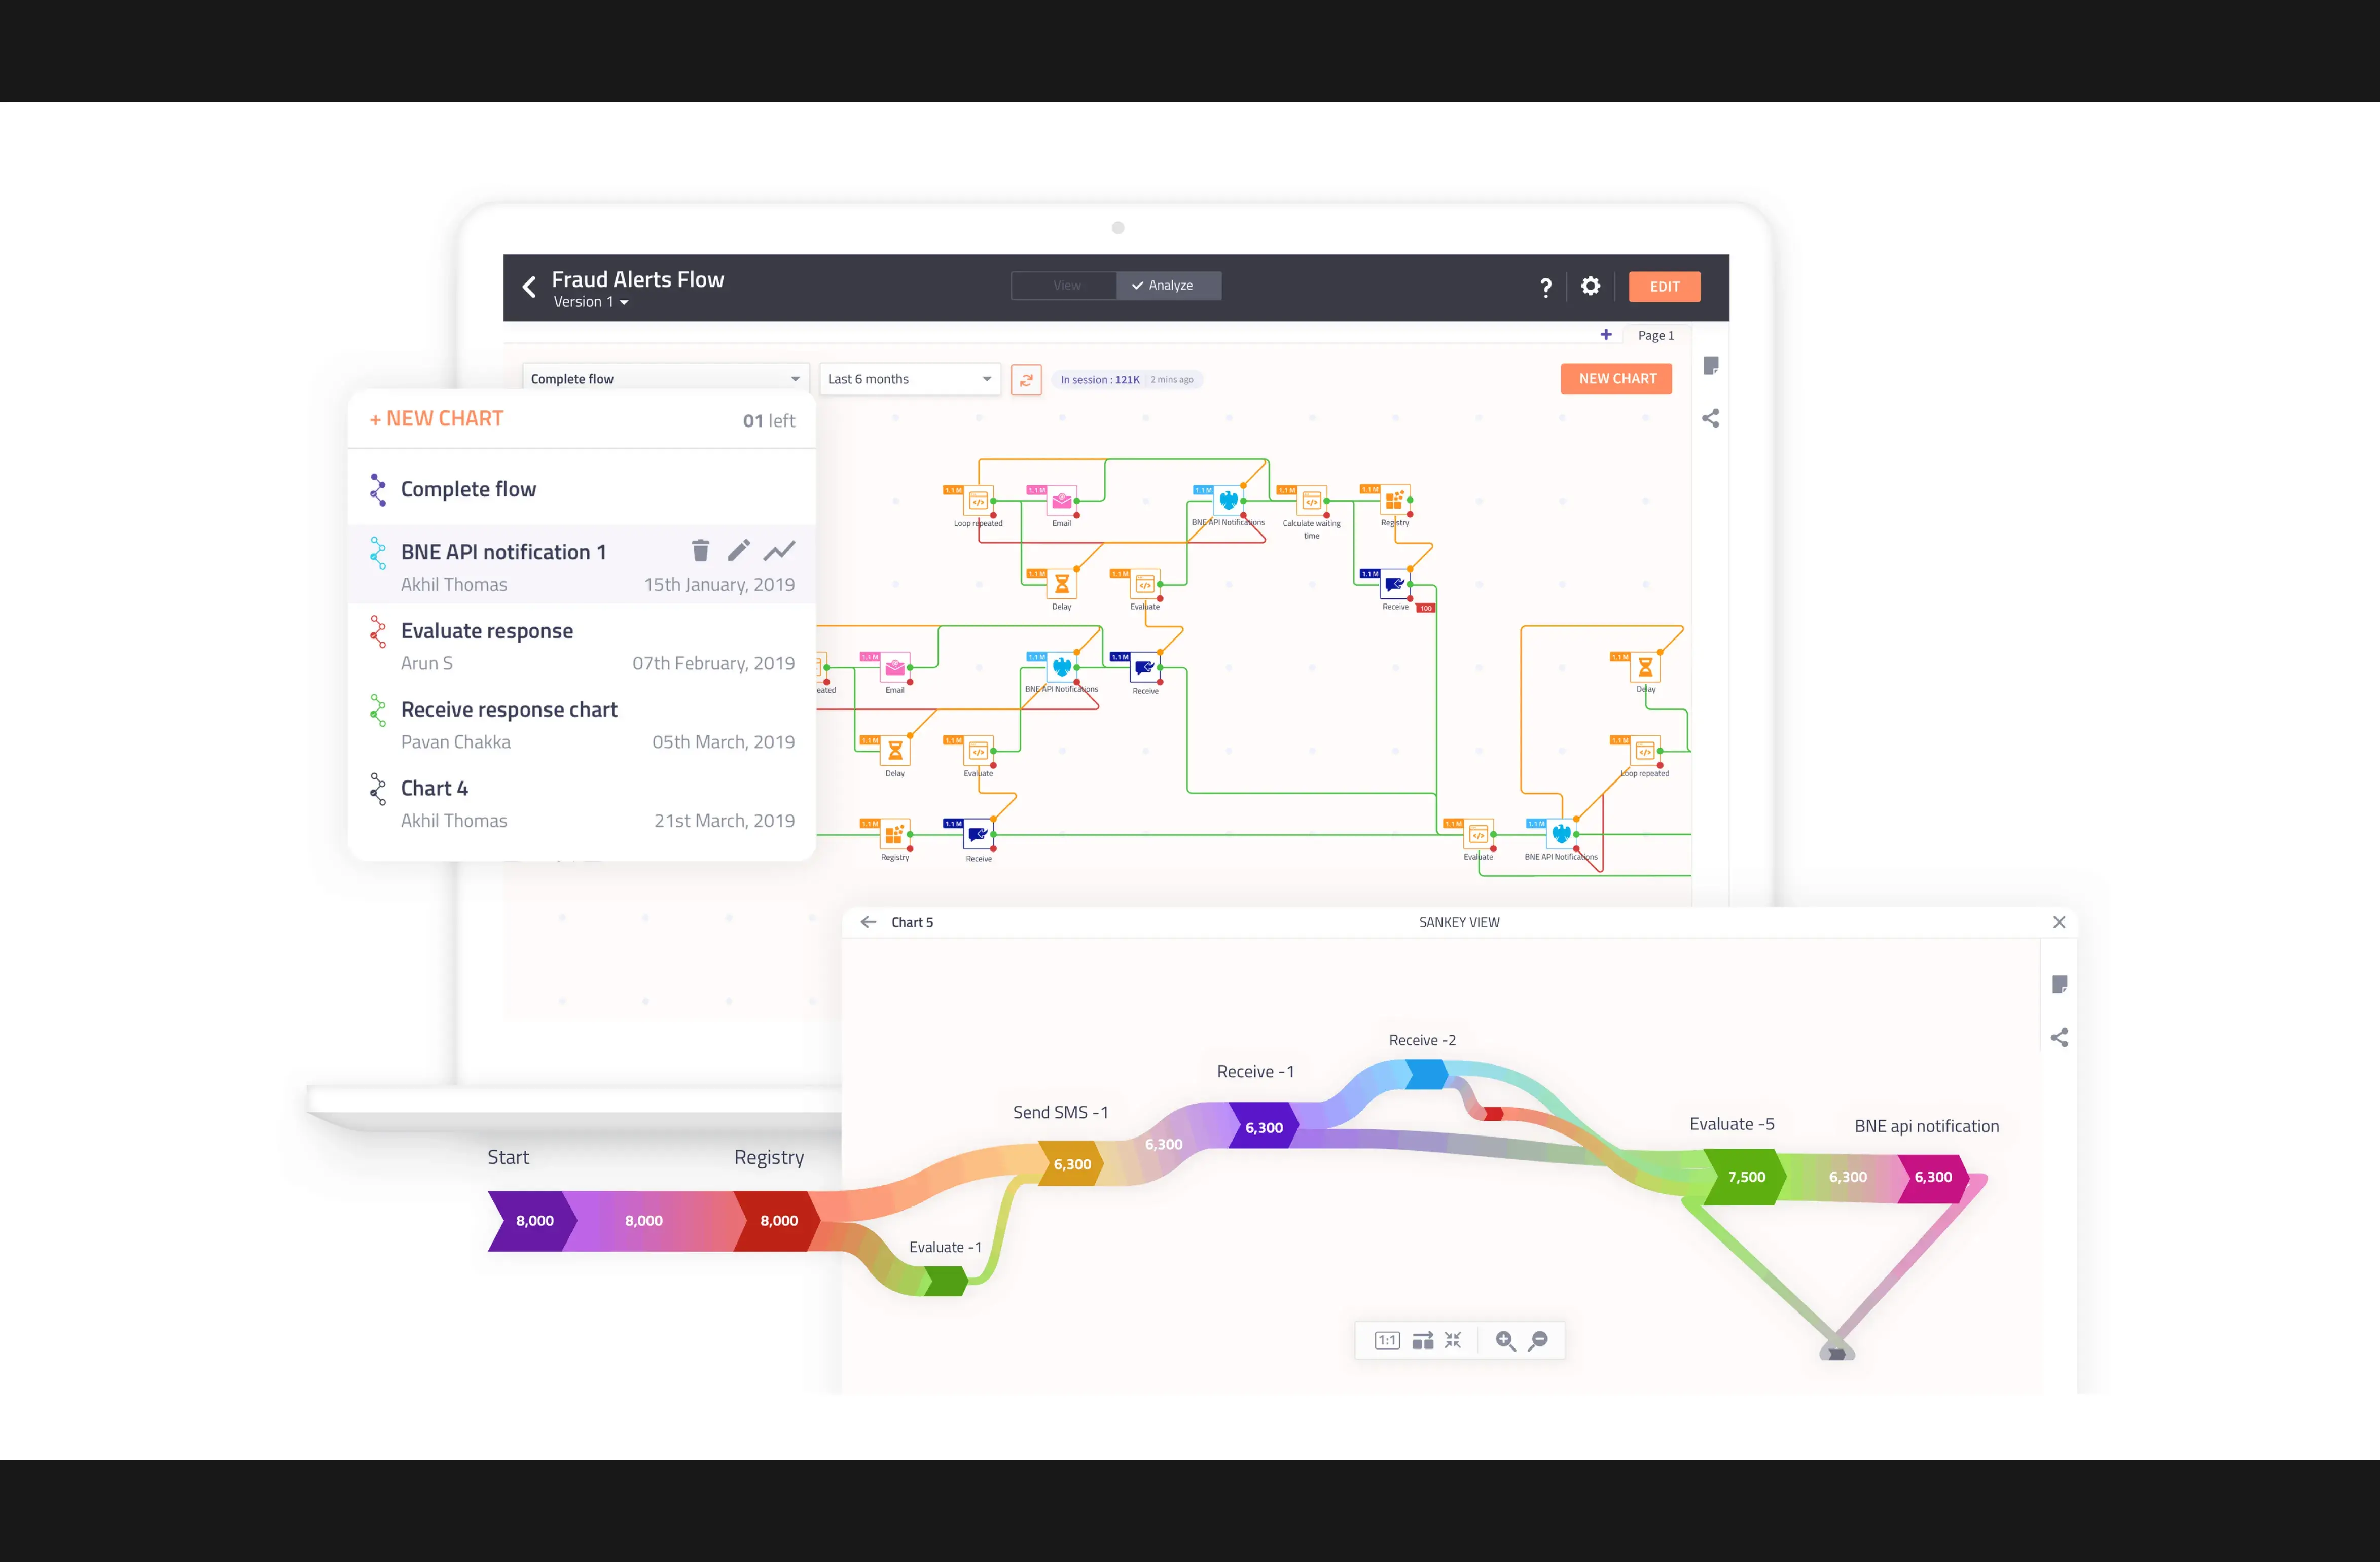
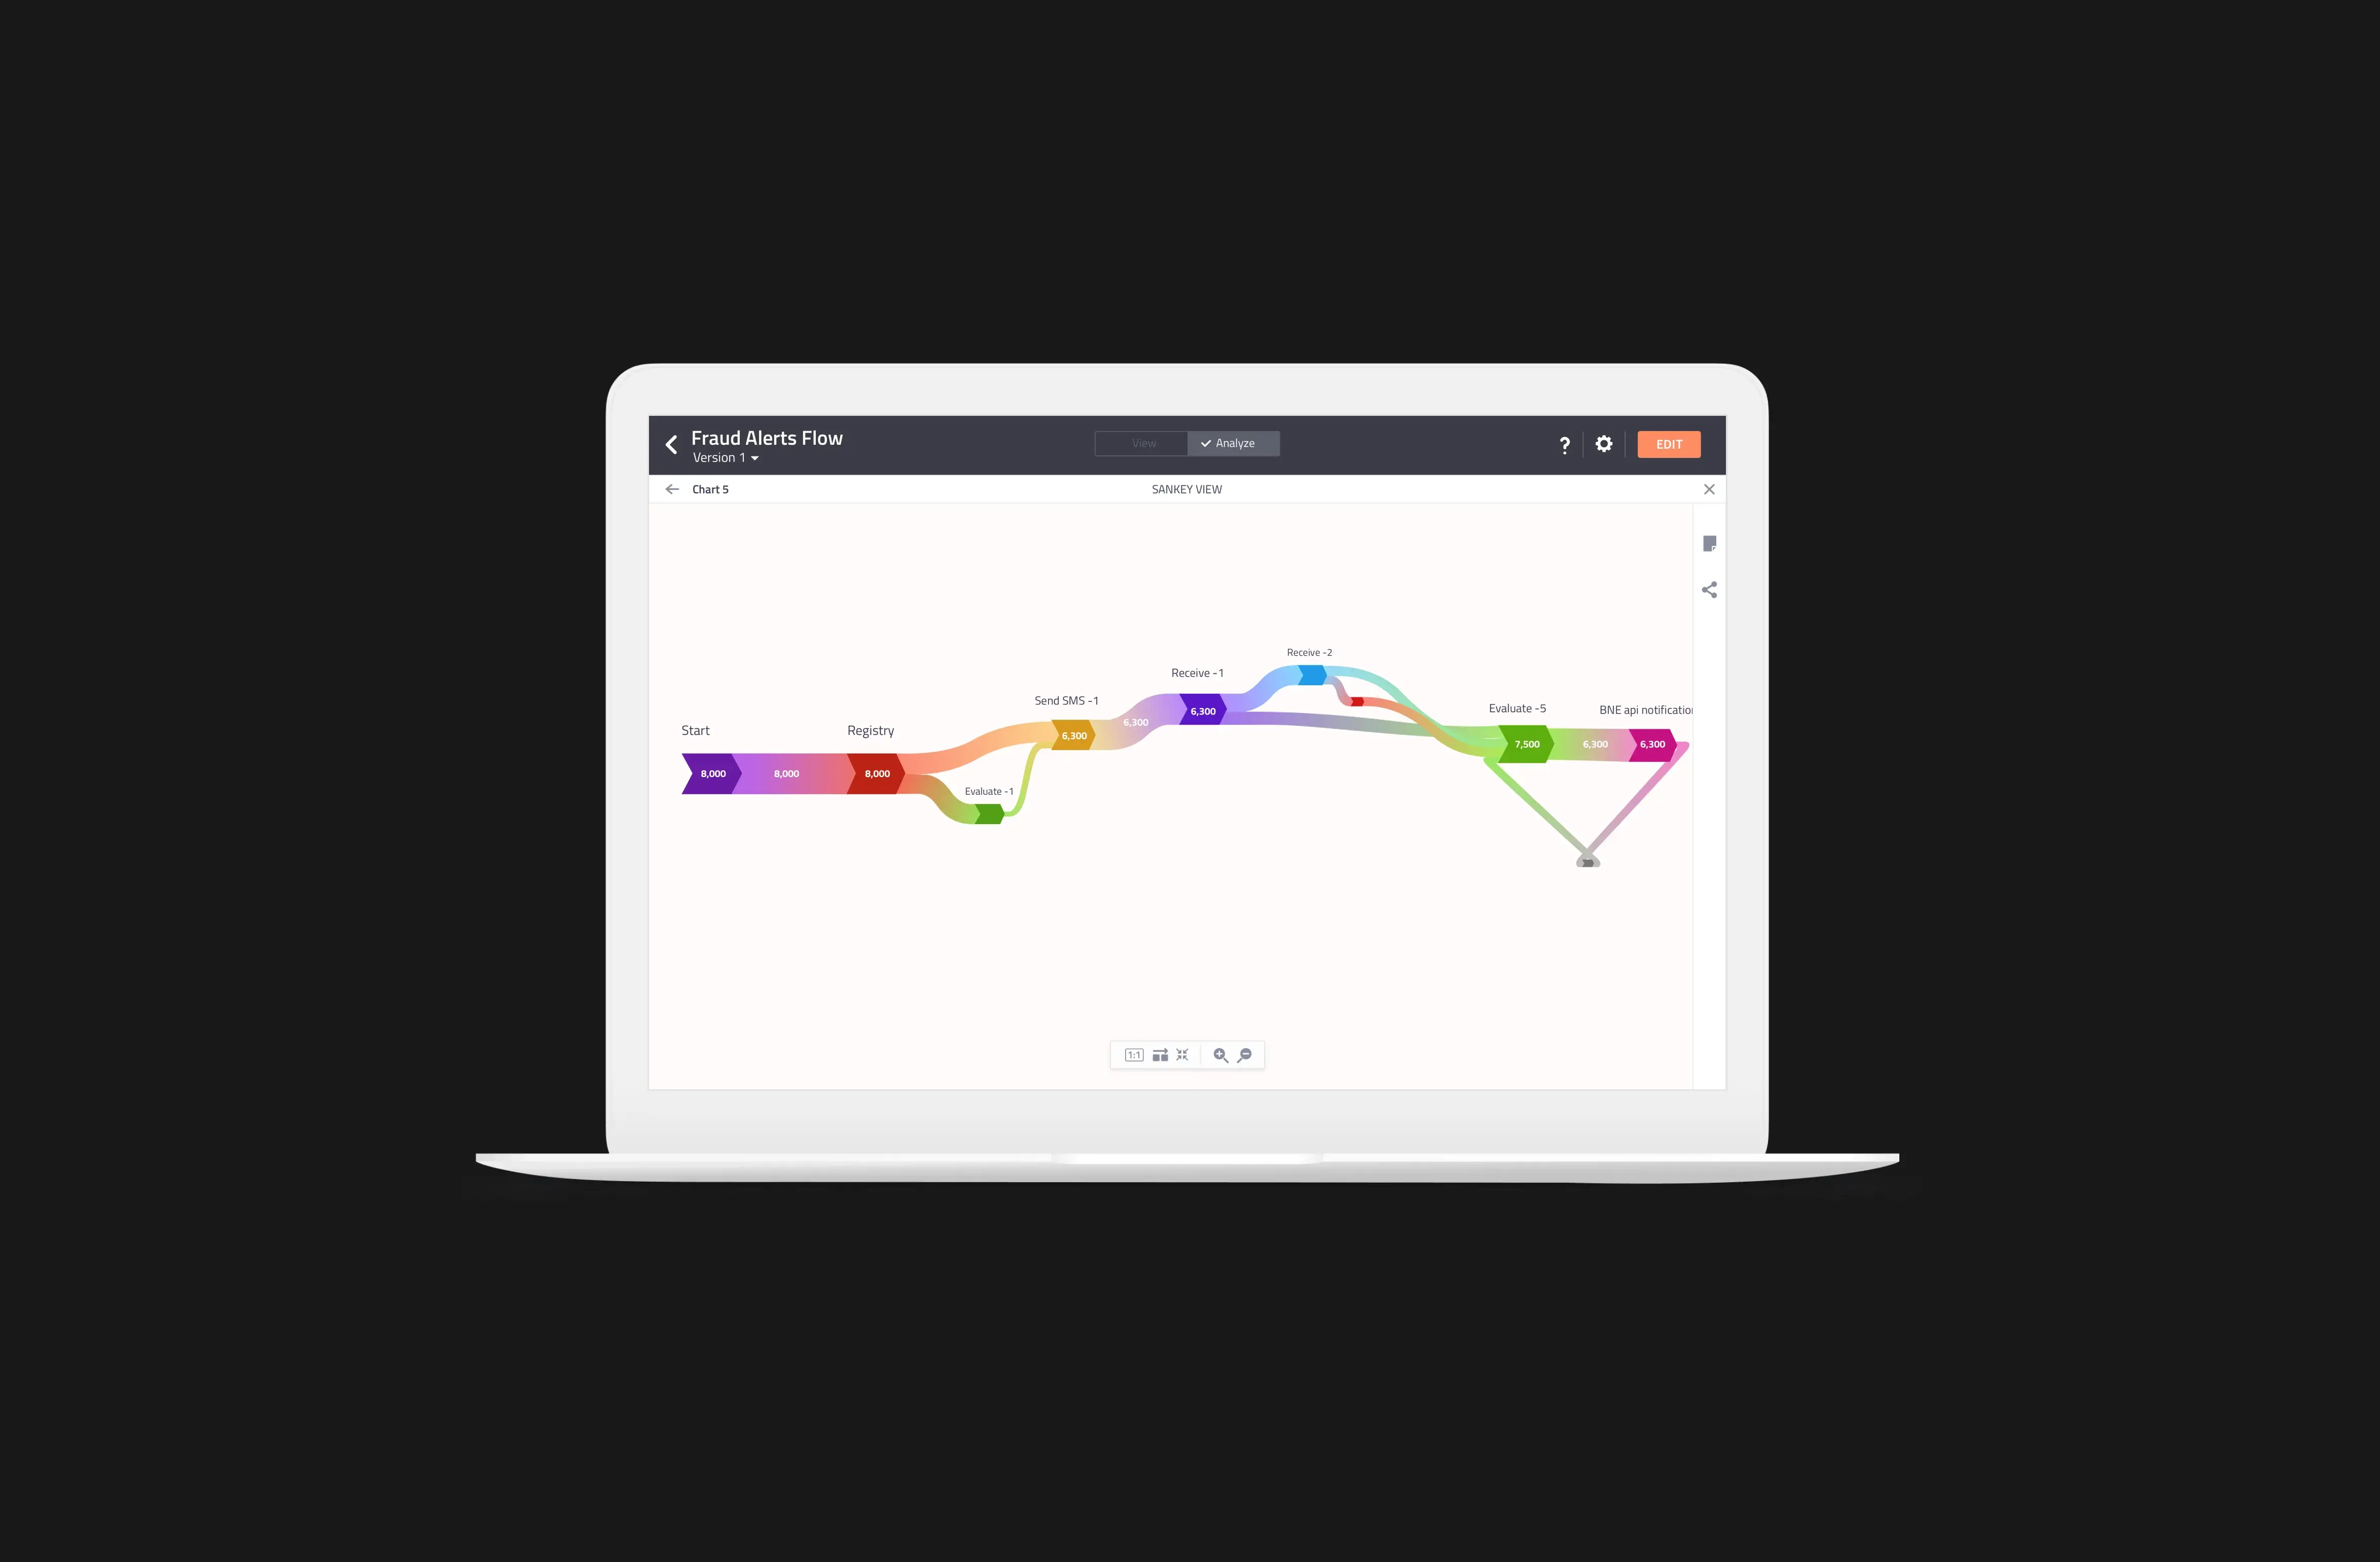
Problem statement 3
Knowing the transaction counts at a node level is good but can I have a simpler visual representation of the data.
Solution
Provide chart view for the segment user has created.
Problem statement 3
Knowing the transaction counts at a node level is good but can I have a simpler visual representation of the data.
Solution
Provide chart view for the segment user has created.
Design
Problem statement 3
Knowing the transaction counts at a node level is good but can I have a simpler visual representation of the data.
Solution
Provide chart view for the segment user has created.
Conclusion
Conclusion
Feature was shipped in 2020. Worked closely with the product managers and both front-end and back-end developers to craft the best possible experience for the user.
Feature was shipped in 2020. Worked closely with the product managers and both front-end and back-end developers to craft the best possible experience for the user.
Conclusion
Feature was shipped in 2020. Worked closely with the product managers and both front-end and back-end developers to craft the best possible experience for the user.
More Works More Works
More Works More Works


AKHIL THOMAS
AKHIL THOMAS
AKHIL THOMAS
AKHIL THOMAS
©2024 VIINCII
GO BACK TO TOP
©2024 VIINCII
GO BACK TO TOP